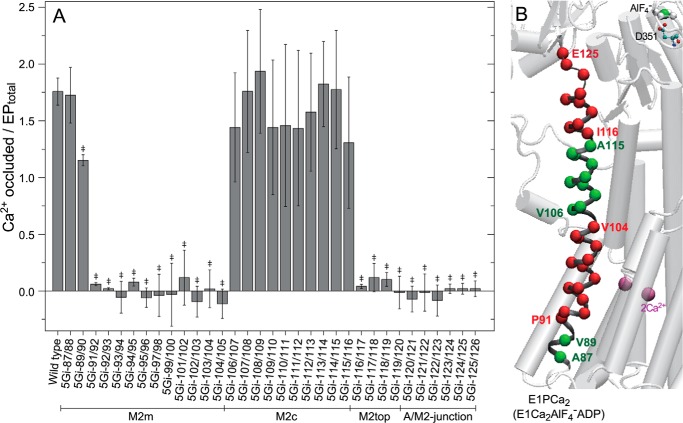
FIGURE 6.
Ca2+ occlusion in EP. A, phosphorylation was performed with ATP in 10 μm 45Ca2+; otherwise conditions were as in Fig. 4. The amount of Ca2+ occluded was determined as described under “Experimental Procedures” and is shown as the value relative to EPtotal (mean ± S.D. (n = 8–18)). Statistical significance compared with the wild type is shown: *, p < 0.05; ‡, p < 0.01. B, the mutation effects of residues in A are visualized with α-carbon coloring; green, Ca2+ occluded/EPtotal above 1.0; red, below 0.15. Error bars, S.D.

