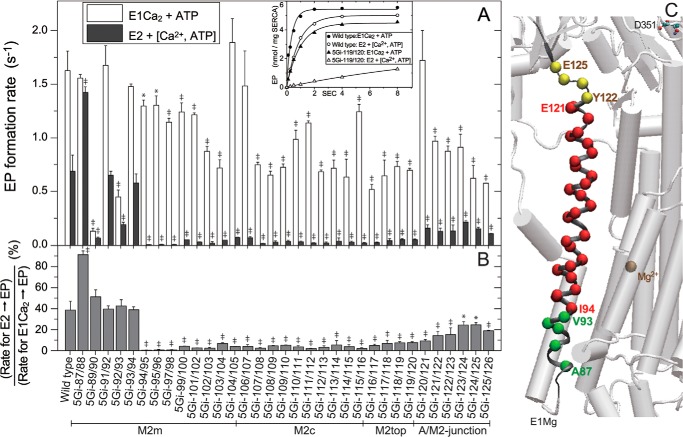
FIGURE 8.
EP formation from E2 and E1Ca2 states. A, microsomes expressing wild type or mutant were preincubated for 20 min at 25 °C in 50 μl of a mixture containing 1–5 μg of microsomal protein, 1 μm A23187, 0.1 m KCl, 7 mm MgCl2, 50 mm MOPS/Tris (pH 7.0), and 1 mm EGTA with and without 1.2 mm CaCl2 (to form the Ca2+-bound (open bar) and unbound (closed bar) states, respectively). After cooling, an equal volume of a phosphorylation mixture containing 10 μm [γ-32P]ATP and 1 mm EGTA with 1.2 or 2.4 mm CaCl2 (to give 0.2 mm Ca2+ for both Ca2+-bound and Ca2+-unbound states) (otherwise as above) was added at 0 °C, and the EP formation time course was followed. In the inset, typical examples with the wild type and mutant 5Gi-119/120 are shown. Solid lines show the least squares fit to a single exponential, and the rates thus determined are shown in the main panel. The Ca2+-unbound state was denoted as E2 for simplicity, and the ratio of the two rates is shown in B. In A and B, statistical significance compared with the respective wild-type value is shown: *, p < 0.05; ‡, p < 0.01. C, the observed effects on the rate-limiting process E2 → E1 in B are visualized with α-carbon coloring; green, no effect or acceleration (ratio higher than 35%); yellow, retardation (ratio 30–15%); red, marked retardation (ratio lower than 15%). Error bars, S.D.

