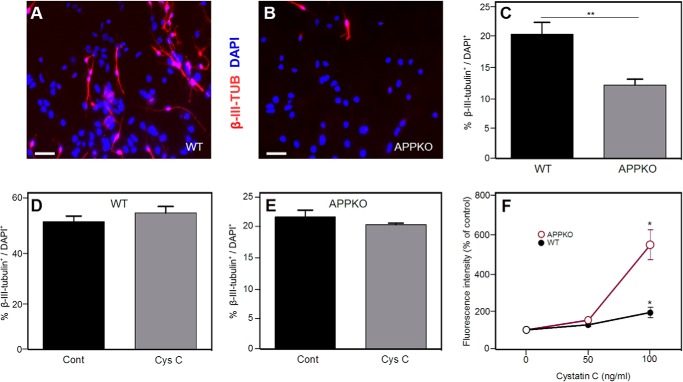
FIGURE 1.
Neuronal differentiation of NSPCs from WT and APPKO mice. Panels A and B show representative immunofluorescence images demonstrating that there are more β-III-tubulin+ (TUB) cells in WT cultures (A) than in APPKO cultures (B) when NSPCs are incubated for 5 days in differentiation conditions. β-III-Tubulin staining (red) and DAPI staining (blue) are shown. C, quantification of results from immunofluorescence analysis. The panel shows % β-III-tubulin+/DAPI+ of ∼300 cells per group in three independent experiments. Bars show the means ± S.E. D and E, percentage of β-III-tubulin+ cells (β-III-tubulin+/DAPI+ × 100%) after cystatin C treatment (100 ng/ml) in WT cultures (D) and APPKO cultures (E). F, effect of cystatin C on NSPC proliferation. Dissociated neurosphere-derived cells were incubated for 5 days in proliferation medium. The number of viable cells was calculated from the fluorescence intensity in an Alamar Blue assay. Values are the means ± S.E. (n = 4) and shown as the percentage of the control value (no added cystatin C) (* = p < 0.05 as assessed by analysis of variance with post hoc Tukey's test; ** = p < 0.01 as assessed by χ2 test). Scale bars = 30 μm. Cont, control; Cys C, cystatin C.

