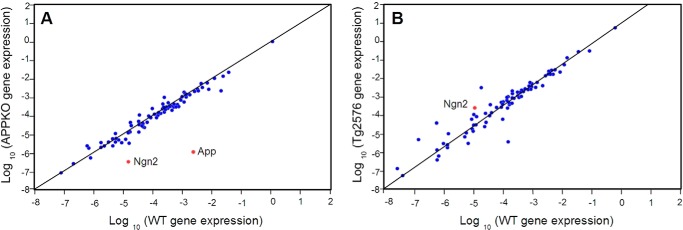
FIGURE 2.

Two-dimensional plot of gene expression levels in APPKO NSPCs (A) or Tg2576 NSPCs (B) versus WT NSPCs. Gene expression was calculated relative to the expression in the corresponding background strain (Tables 1 and 2) and is shown on a log10 scale. Eighty-four genes were analyzed. Gene expression relative to β-actin (reference gene) is shown. Analysis of gene expression from n = 3 independent experiments was carried out using the RT2 profiler PCR array data analysis v3.5 provided by Qiagen.
