FIGURE 4.
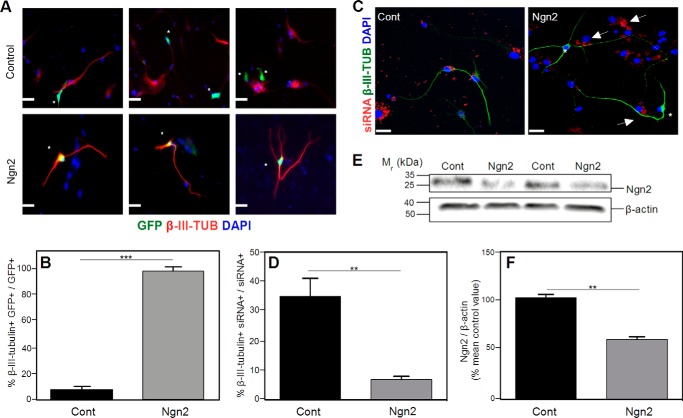
Transfection of NSPCs with a Ngn2 cDNA induces neuronal differentiation. Cells were cultured for 5 days in differentiation medium. A, NSPCs derived from APPKO mice were transfected either with empty vector pCAG-IRES-GFP (Control) or with pCAG-Ngn2-IRES-GFP (Ngn2). The figure shows 3 independent representative immunofluorescence images for each group. Transfected cells (green) are marked with asterisks. Cells were stained for β-III-tubulin (red). No double-stained GFP+ β-III-tubulin+ cells were observed in empty vector incubation, indicating that cells transfected with the empty vector are not neurons. In cells transfected with the Ngn2 plasmid, there was co-staining of GFP and β-III-tubulin, indicating that each cell transfected with Ngn2 was neuronally differentiated. B, quantification of the results in panel A shows the % of β-III-tubulin+ GFP+ cells to total GFP+ cells. C, representative immunofluorescence images of NSPCs derived from WT mice transfected with siRNA-control-Cy3 vector or siRNA-Ngn2-Cy3 vector (Ngn2). The figure shows siRNA (red), β-III-tubulin (green), and DAPI (blue) staining. Cells transfected with the control plasmid (61) showed co-staining of siRNA and β-III-tubulin. Cells transfected with the Ngn2 siRNA (Ngn2), marked with arrows, were not β-III-tubulin+ (asterisk). D, quantification of the results in C showing the % β-III-tubulin+ siRNA+ cells to total siRNA+ cells. F, western blotting analysis of Ngn2 levels. The figure shows a representative western blot (E) and quantification (F). Decreased expression of Ngn2 was observed in NSPCs after siRNA interference. Cells were cultured for 5 days in differentiation medium. β-Actin was used as a control for protein loading. Scale bars = 50 μm. Data are expressed as the means ± S.E. (** = p < 0.001; *** = p < 0.0001 as determined by Student's t test). Cont, control; Ngn2, neurogenin 2.

