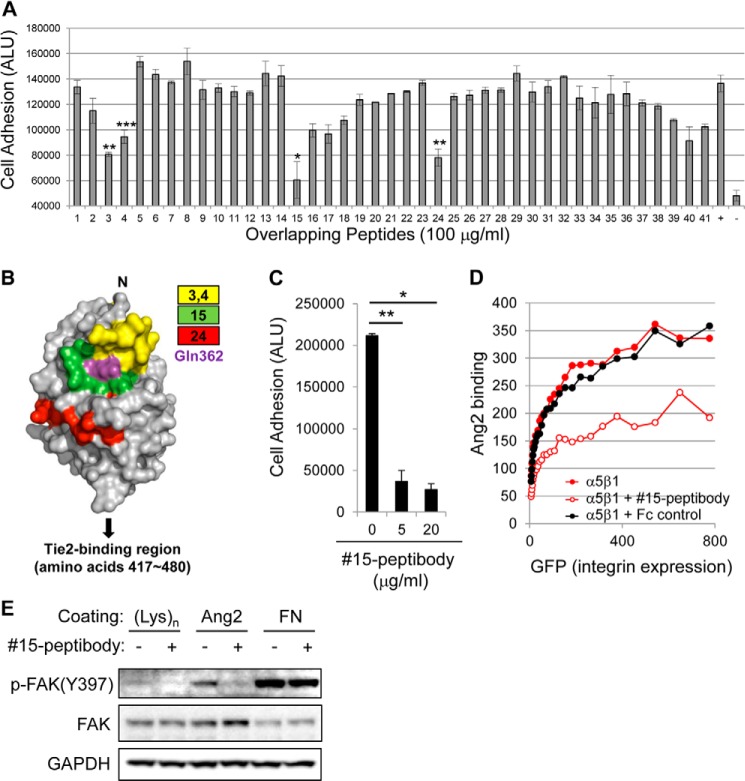
FIGURE 3.
Mapping of integrin-binding sites in Ang-2. A, analysis of Ang-2-dependent U87MG cell adhesion was performed as described in the legend to Fig. 1A with the addition of 100 μg/ml of each peptide (Table 1). ALU, arbitrary light units. +, positive control without any peptide; −, negative control in which cells were incubated in BSA-coated wells. Note that peptides 3, 4, 15, and 24 showed >50% inhibition of cell adhesion. Error bars, S.E. (*, p < 0.001; **, p < 0.01; ***, p < 0.05). B, maps of inhibitory peptides on the surface of the Ang-2 RBD using previously reported structural information (Protein Data Bank entry 2GY7) (15). Each peptide is represented by a different color. The Gln-362 residue is indicated by magenta. C, analysis of Ang-2-dependent U87MG cell adhesion was performed in the presence of different doses of 15-peptibody. Data are shown as means ± S.D. (error bars) (*, p < 0.001; **, p < 0.01). D, inhibition of the Ang-2-α5β1 integrin interaction by 15-peptibody was examined by flow cytometry. Fc fragment of human IgG was used as a negative control. E, the inhibitory effect of 15-peptibody on Ang-2-dependent phosphorylation of FAK at the Tyr-397 site.

