FIGURE 11.
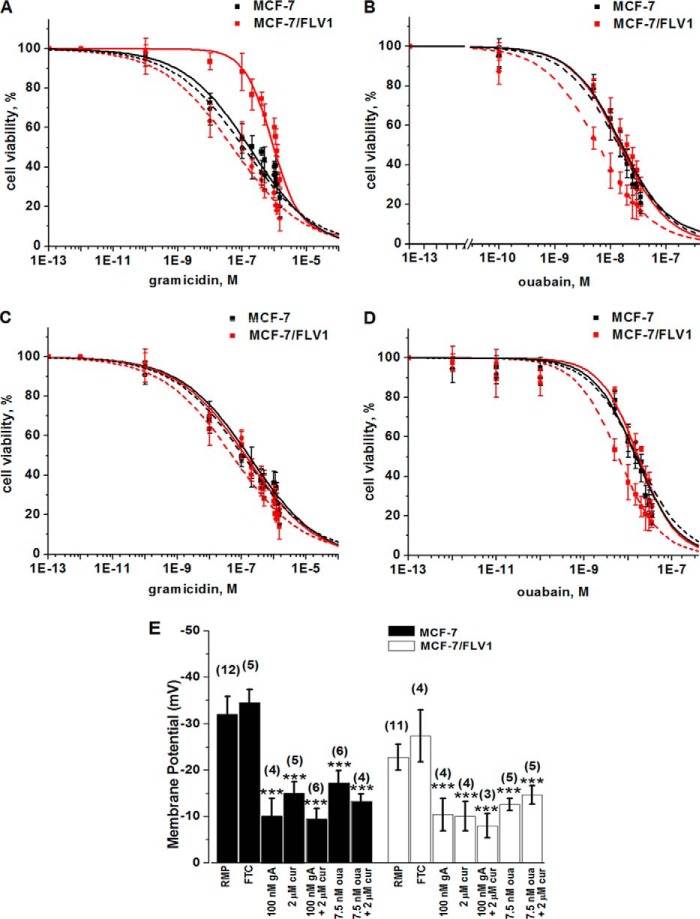
Cell viability of MCF-7 and MCF-7/FLV1 cells as a function of increasing gA or ouabain concentrations and effect of curcumin, gA, and ouabain on the RMP of MCF-7 and MCF-7/FLV1 cells. A, sensitivity of MCF-7 cells (black) and MCF-7/FLV1 cells (red) to gA in the absence (solid curves) or presence (dashed curves) of 2 μm curcumin. B, sensitivity of MCF-7 cells (black) and MCF-7/FLV1 cells (red) to ouabain in the absence (solid curves) or presence (dashed curves) of 2 μm curcumin. C and D, cell viability of MCF-7 cells (black) and MCF-7/FLV1 cells (red) exposed to increasing doses of gA (C) or ouabain (D) in the presence of 2 μm curcumin (cur) in the absence (dashed curves) or presence (solid curves) of 10 μm FTC (see Table 5 for a statistical analysis of differences in IC50 values). E, effect of curcumin (cur), gA, and ouabain (oua) on the RMP of MCF-7 cells (black bars) and MCF-7/FLV1 cells (white bars). Cells were incubated under various conditions as indicated. The bars labeled with RMP represent the control without addition of compound(s). FTC was used at a concentration of 10 μm. Triple asterisks indicate a difference compared with the control (RMP) with a p value ≤ 0.001. The values in brackets indicate the numbers of measurements.

