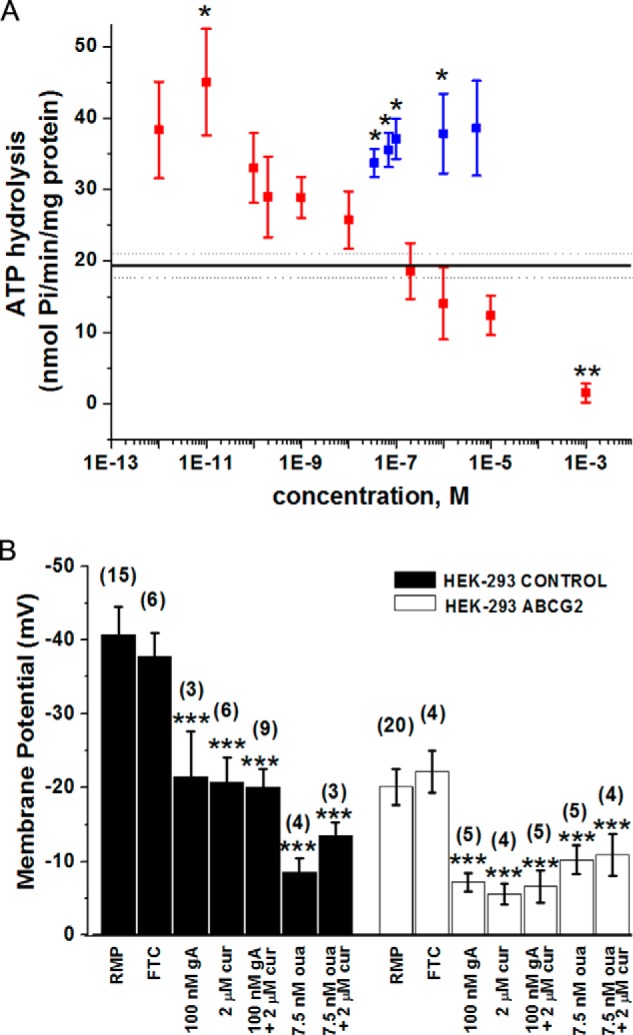
FIGURE 5.

Effects of gA and ouabain on the ATP hydrolysis rate by the Na+,K+-ATPase in crude membrane fragments from HEK-ABCG2 cells and on the RMP of HEK-293 control and HEK-ABCG2 cells. A, stimulatory and inhibitory effect of various concentrations of ouabain (red) and gA (blue) on the ATP hydrolysis rate by the Na+,K+-ATPase in crude membrane fragments from HEK-ABCG2 cells. A single asterisk indicates a difference compared with the basal hydrolysis rate (black horizontal line) with a p value ≤ 0.05; a double asterisk indicates a p value ≤ 0.01. B, effect of curcumin (cur), gA, and ouabain (oua) on the RMP of HEK-293 control (black bars) and HEK-ABCG2 cells (white bars). The cells were incubated under various conditions as indicated. The bars labeled with RMP represent the control without addition of compounds. FTC was used at a concentration of 10 μm. Triple asterisks indicate a difference compared with the control (RMP) with a p value ≤ 0.001. The values in brackets indicate the numbers of measurements.
