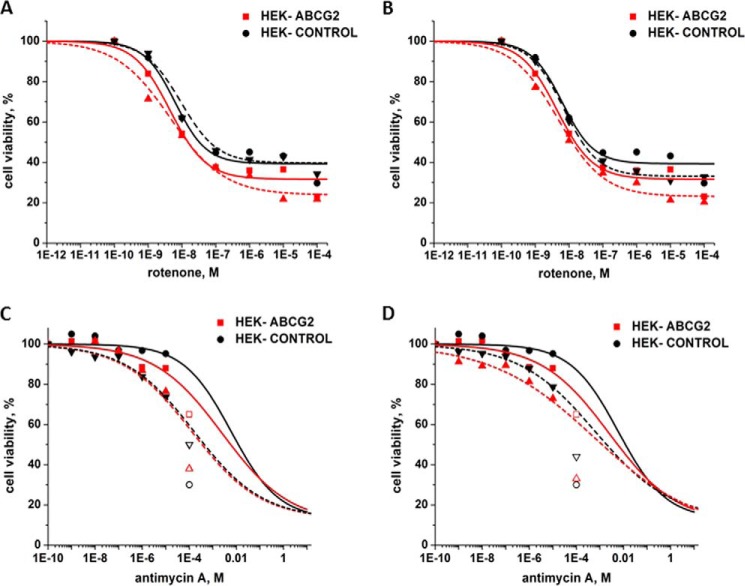
FIGURE 8.
Sensitivity of HEK-293 control and HEK-ABCG2 cells to inhibitors of the electron transport chain. A, toxicity of increasing concentrations of rotenone on HEK-ABCG2 (red) and parental cells (black) in the absence (solid curve) or presence of 2 μm curcumin and 35 nm gA (dashed curve). B, toxicity of increasing concentrations of rotenone on HEK-ABCG2 (red) and parental cells (black) in the absence (solid curve) or presence of 2 μm curcumin and 7.5 nm ouabain (dashed curve). C, toxicity of increasing concentrations of antimycin A on HEK-ABCG2 (red) and parental cells (black) in the absence (solid curve) or presence of 2 μm curcumin and 35 nm gA (dashed curve). D, toxicity of increasing concentrations of antimycin A on HEK-ABCG2 (red) and parental cells (black) in the absence (solid curve) or presence of 2 μm curcumin and 7.5 nm ouabain (dashed curve). The open symbols in C and D indicate that antimycin was not soluble at this concentration. These points were not included in the best curve fits.

