
FIGURE 1.
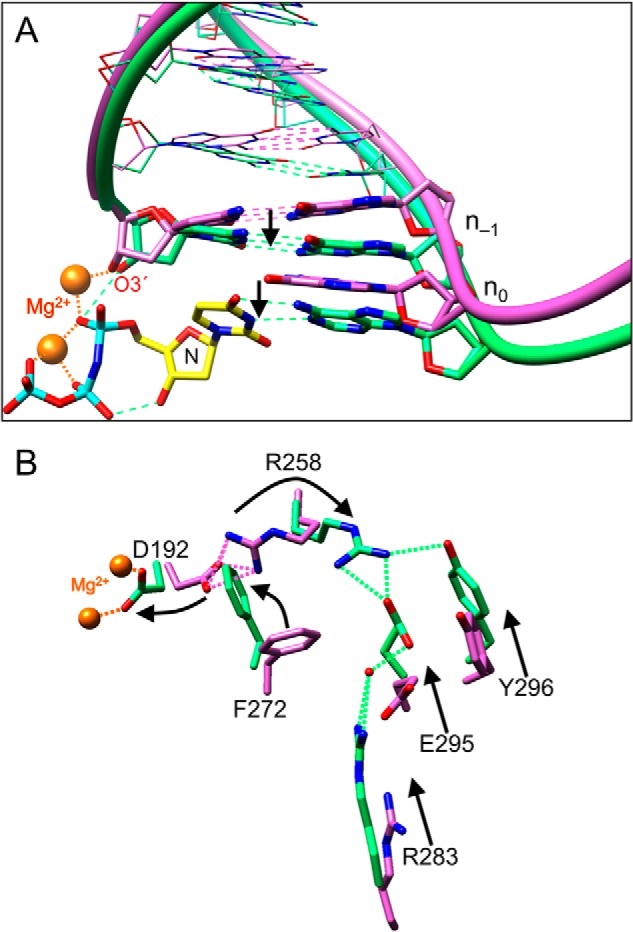
Open and closed conformations of key pol β and DNA residues. The crystallographic structures of the catalytic subdomains of the open binary DNA (PDB accession code 1BPX; pink carbon atoms) and closed ternary substrate complex (PDB accession code 2FMS; green, protein and DNA carbon atoms; yellow, dNTP carbon atoms) were superimposed (root mean square deviation = 1.0 Å). A, a view of the DNA major groove edge of the nascent base pair and primer terminus (O3′, stick representation) illustrating repositioning of the template strand and primer bases upon forming the closed ternary complex. The arrows represent a shift in the template strand associated with the closing transition where the template strand moves toward the N-subdomain. Base pairs upstream of the primer terminus are illustrated in a wire representation. The polymerase is omitted for clarity. The incoming nucleotide and its coding template base of the ternary complex are labeled N and n0, respectively. B, the position of the N-subdomain can be monitored in the active site through a series of altered interactions between Asp-192 (D192), which coordinates both active site metals (orange), and Arg-283 (R283), that is situated in the N-subdomain and interacts with the minor groove edge of the templating strand (not shown). The arrows represent motions associated with the closing transition. N-subdomain closing is associated with Arg-258 (R258) releasing Asp-192 and forming hydrogen bonds with Glu-295 (E295) and Tyr-296 (Y296). Phe-272 (F272) is repositioned in the closed complex to insulate Asp-192 from Arg-258. The DNA is omitted for clarity.