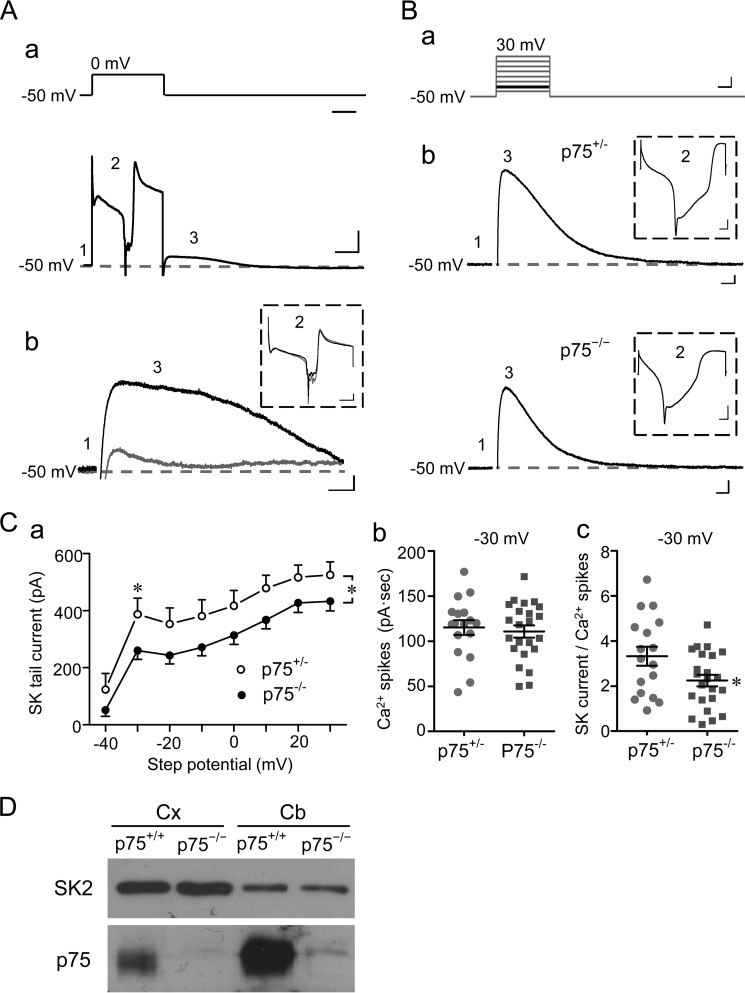
FIGURE 3.
p75 regulates SK channel activity in Purkinje cells. A (a), voltage step protocol used to record SK-mediated tail currents from Purkinje neurons in cerebellar slices (top) and a representative current trace (bottom) with the three regions (numbered 1–3) indicated. Region 1 represents the basal current when the cell was voltage-clamped at −50 mV; region 2 represents the current response to the voltage step, showing development and inactivation of an inward Ca2+ current complex; region 3 represents the outward tail current. A (b), representative traces of tail currents (region 3) obtained before (black) and during (gray) bath application of 100 nm apamin for the same WT Purkinje neuron. The Ca2+ spike complex (region 2) from the same record is shown in the inset with different scales. Scale bars, 100 ms (A (a), top); 100 ms, 500 pA (A (a), bottom); 30 ms, 30 pA (A (b)); and 50 ms, 300 pA (A (b), inset). B (a), voltage step protocol used for comparing SK-mediated tail currents between p75+/− and p75−/− Purkinje neurons in cerebellar slices. The cell was held at −50 mV for 50 ms before stepping to potentials between −40 mV and +30 mV in eight steps (10 mV/step, 100-ms duration, 30-s intervals). B (b), representative traces of SK-mediated tail currents from p75+/− and p75−/− Purkinje cells evoked by the voltage step to −30 mV (highlighted in black in B (a)). Scale bars, 25 ms, 20 mV (B (a)), 25 ms, 50 pA (B (b)), and 10 ms, 500 pA (B (b), inset). For all representative traces, the dashed gray lines indicate basal current levels. C (a), I-V relationship of SK-mediated tail currents for p75+/− (n = 17) and p75−/− (n = 23) Purkinje cells. Peak tail currents were plotted against step potentials. *, p < 0.05, between p75+/− and p75−/− (two-way analysis of variance followed by LSD post hoc tests). C (b), integral current of Ca2+ spike complex elicited by a voltage step (−50 to −30 mV) for individual neurons. Lines, mean ± S.E. (error bars). No significance was found between p75+/− and p75−/− neurons (Student's t test, p = 0.57). C (c), SK tail current normalized to the integral current of Ca2+ spike complex of the same recording of individual neurons. Lines, mean ± S.E. *, p = 0.03 between p75+/− and p75−/− neurons by Student's t test. D, SK2 protein levels in the cerebellum (Cb) and cortex (Cx) are unchanged in p75−/− mice.

