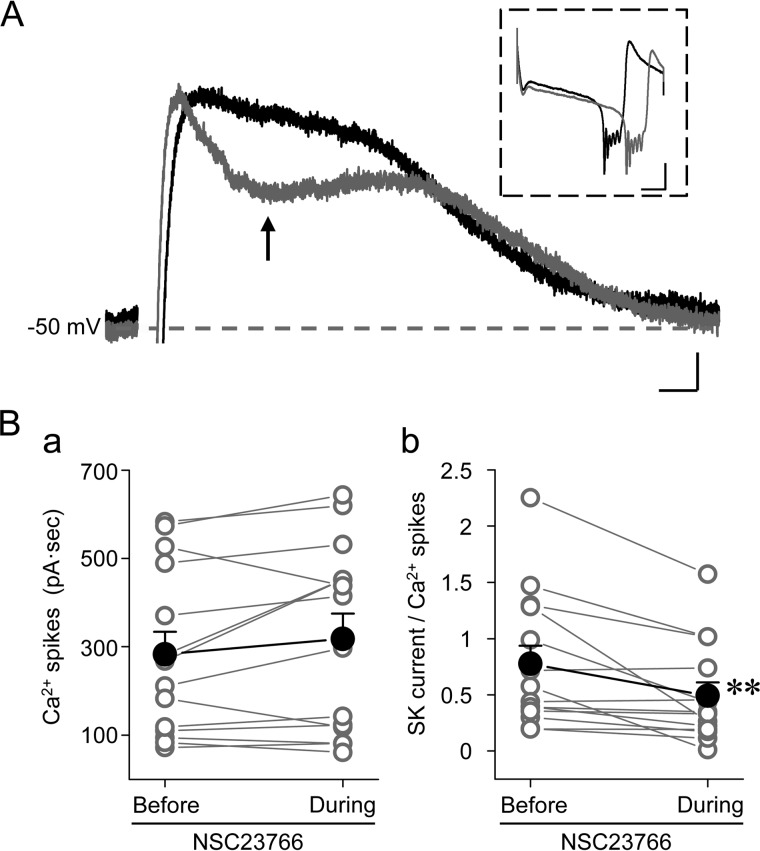
FIGURE 6.
SK channel activity is regulated by Rac1 in Purkinje cells. A, representative traces of SK-mediated tail currents in a WT Purkinje cell before (black) and during (gray) bath application of 100 μm NSC23766. The same protocol was used as in Fig. 3A (a). The arrow indicates the point of maximal inhibition, from where the inhibitory effect of NSC23766 was measured for data analysis. The inset shows Ca2+ spike complexes from the same records. Scale bars, 30 ms, 20 pA; 50 ms, 300 pA for inset. B, individual (open circles) and summary data (filled circles) for integral currents of Ca2+ spike complexes (B (a)) and amplitudes of SK-mediated tail currents at the point indicated in A normalized to the integral currents of Ca2+ spike complexes (B (b)) before and during the treatment with NSC23766. **, p < 0.01, paired t test (n = 14).

