FIGURE 8.
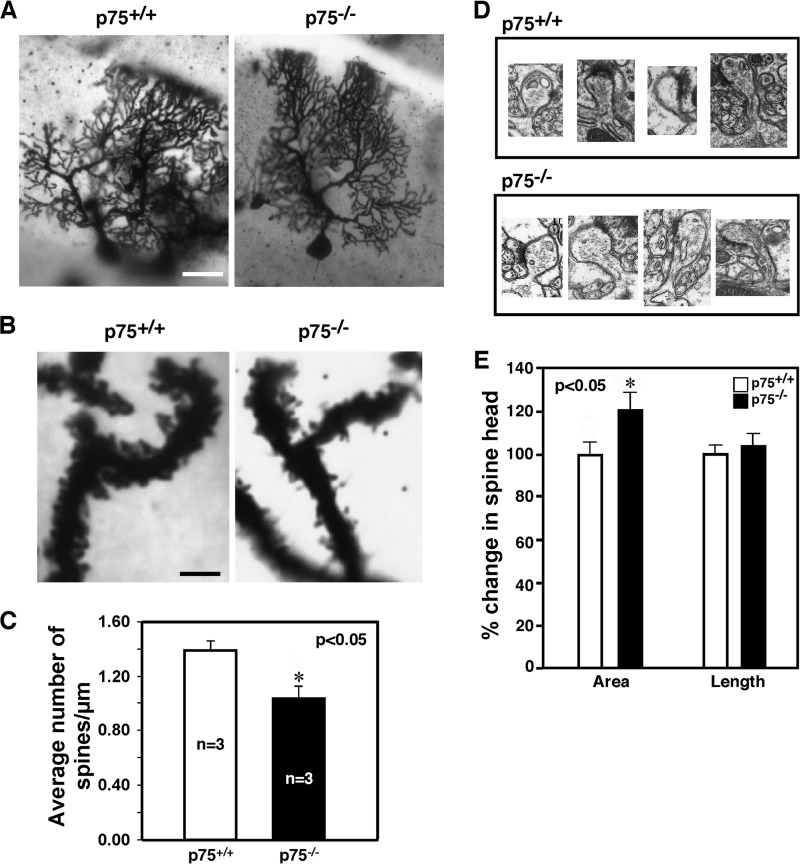
Reduction in the number of spines in Purkinje cells in the absence of p75. A, representative images of Purkinje cells stained with Golgi from adult p75+/+ and p75−/− mice. Scale bar, 25 μm. B, representative images of Purkinje cell dendrites that were used for quantification of spines. Scale bar, 6 μm. C, quantification of the number of spines. Five Purkinje neurons in lobules 4, 5, 6, and 7 per mouse were analyzed using the Neurolucida® version 7 image analysis system (MBF Biosciences), and the spine density was estimated (n = 3 mice). For each Purkinje neuron, at least five different secondary and tertiary dendritic branches were randomly selected for spine analysis at ×100 magnification to obtain the estimated values for the number of spines in a given length. D, representative EM images of Purkinje cell spines from adult p75+/+ and p75−/− mice. E, quantification of spine area and spine length based on EM images collected from three different sets of mice and a total of 29 spines with features of post-synaptic density (PSD) using ImageJ.

