FIGURE 3.
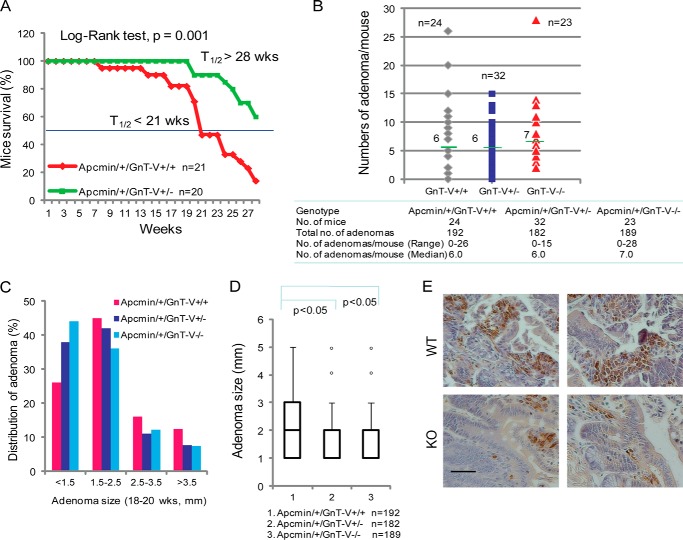
GnT-V regulates colon adenoma progression in Apcmin/+ mice. A, Kaplan-Meier curves were used to display the survival of Apcmin/+ mice in different GnT-V backgrounds (p = 0.001). t½ represents the time point at which 50% of mice in that group survive. B, Apcmin/+ mice in different GnT-V backgrounds were grown to the age of 18–20 weeks, and the number of adenoma formed in intestine was examined. Horizontal bars represent the median value of adenomas per mouse. C, distribution of adenomas of Apcmin/+ mice in different GnT-V backgrounds based on their size. D, Box Plot analysis of the adenoma size of Apcmin/+ mice with different GnT-V genotypes. E, intestines were dissected at week 18, and immunochemical staining was performed using antibody against Ki-67. Bar, 20 μm.

