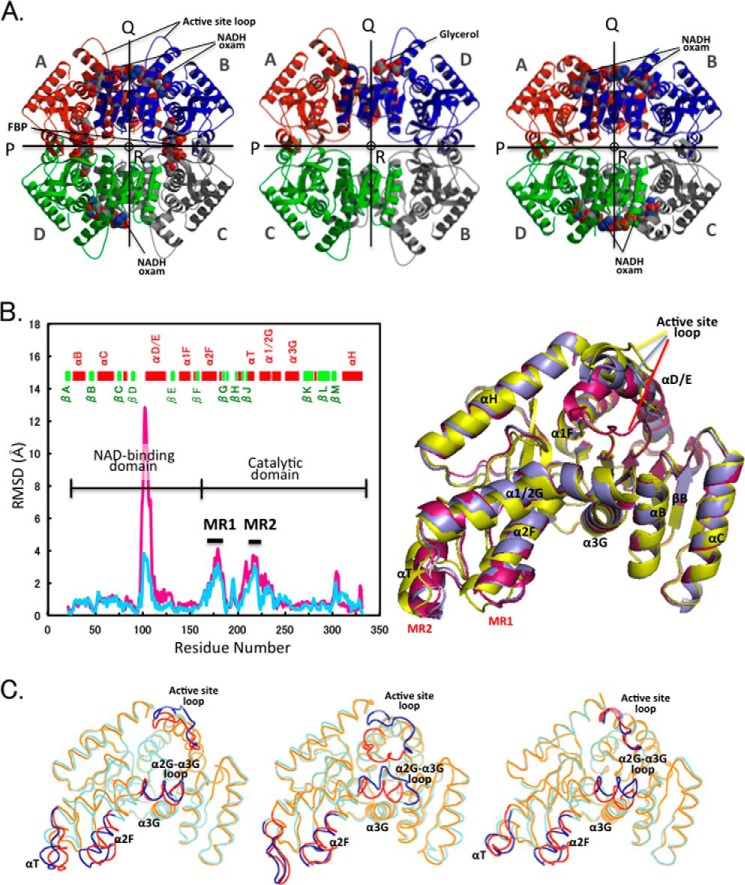
FIGURE 3.
Quaternary and tertiary structural changes in the allosteric transition. A, ribbon diagrams of the tetrameric structures: liganded (R state) (left panel) and unliganded (T state) (center panel) structures of TcLDH and holo TtLDH structure (right panel). All the structures are viewed along the molecular R-axis. The four subunits are colored red, green, blue, and gray. The P-, Q-, and R-axes are indicated by arrows and a circle. Each of the subunits is named according to the name registered in Protein Data Bank. B, left, deviation of Cα atoms (RSMD values) between the R and T state structures of TcLDH (light blue line) and the holo and apo structures of TtLDH (pink line). MR1 and MR2 indicate mobile regions that display marked deviation (more than 2.0 Å) in the two structures of TcLDH. Right, superimpositioning of the R state of TtLDH (magenta) and R state (purple) and T state (yellow) TcLDH subunit structures. The subunits (subunits A in A) of R state TtLDH and T state TcLDH were fitted with subunit A of R state TcLDH by means of least squares deviation for Cα atoms. C, superimpositioning of the backbone structures of the T and R state structures for TcLDH (left panel), BlLDH (center panel), and LcLDH (right panel). The T and R state structures are shown in cyan and orange, respectively, and the regions that show more than 2.0 Å RMSD (at Cα) in any of the three enzymes are indicated by blue and red for the T and R states, respectively.

