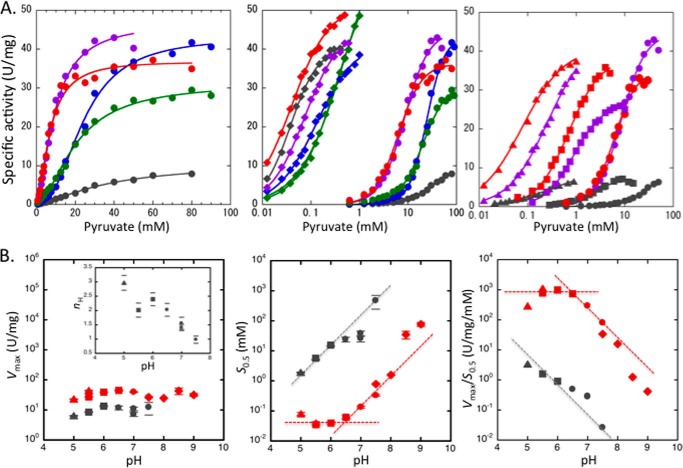
FIGURE 6.
Catalytic profiles of the wild-type and mutant TcLDHs. A, pyruvate saturation profiles for the wild-type and mutant TcLDHs at pH 7.0. Left panel, pyruvate saturation curves for the Q mutant enzymes in the absence of FBP. The reaction velocities for the wild-type enzyme (gray), and the Q2 (L67E/H68D) (blue), Q3 (L67E/H68D/E178K) (green), Q4(K) (L67E/H68D/E178K/A235K) (purple), and Q4(R) (L67E/H68D/E178K/A235R) (red) mutant enzymes were measured with the indicated concentrations of pyruvate. Center panel, pyruvate saturation curves without FBP (circles) and with 0.1 mm FBP (diamonds). The symbols for the Q4(K) and Q4(R) enzymes are purple and red, respectively, according to the left panel. The concentrations of pyruvate are plotted on a logarithmic scale. Right panel, pyruvate saturation curves showing the additive activation effects of the P1 (R173Q) and P2 (R173Q/R216L) mutations on the Q4 mutant enzymes. The colors of the symbols indicate the difference in the Q4 mutation of the enzymes, i.e. the enzymes containing no Q mutation (gray) or containing the Q4(K) (purple) or Q4(R) (red) mutation, and the shapes of the symbols indicate the differences in the P mutations for the enzymes with no P mutation (circles) and with the P1 (squares) or P2 (triangles) mutations. The lines indicate the calculated saturation curves obtained with the kinetic parameters shown in Table 2. B, pH profiles of the kinetic parameters during pyruvate reduction by the wild-type and Q4(R)/P2 mutant enzymes without FBP. The pH dependence of the Vmax (left panel), S0.5 (center panel), and Vmax/S0.5 (right panel) values for the wild-type (gray) and Q4(R)/P2 mutant (red) enzymes are logarithmically plotted versus pH. The buffers used for the assay were 50 mm sodium acetate (triangles), MES (squares), MOPS (circles), and Tris-HCl (diamonds). The inset in the left panel shows the pH dependence of the Hill coefficient (nH) in the reaction of the wild-type enzyme. The short lines above and below the symbols in the left and center panels indicate standard deviations in the curve fittings. The broken lines in the center and right panels were drawn without a slope or with a slope of 1.0.

