
FIGURE 2.
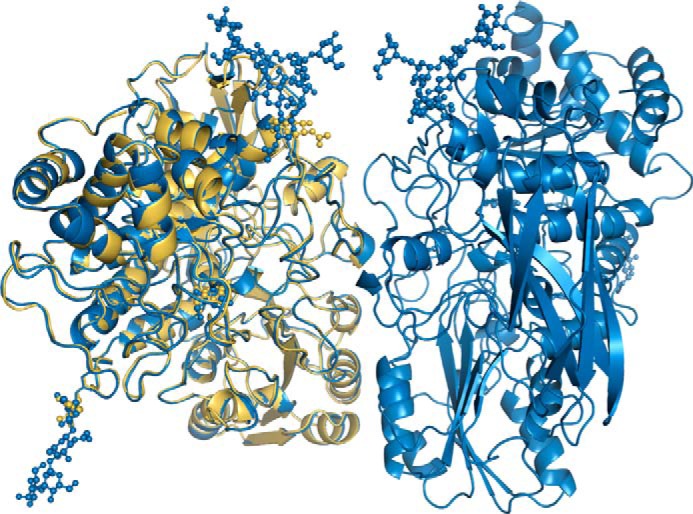
Superposition of the HjCel3A and the Pp-HjCel3A structures. The schematic representation of the HjCel3A crystal structure, with a single protein molecule in the asymmetric unit, is colored yellow, whereas the schematic representation of the Pp-HjCel3A crystal structure is colored blue for both of the protein molecules of the asymmetric unit. The glycosylations of HjCel3A and Pp-HjCel3A are depicted using a ball-and-stick representation.