
FIGURE 4.
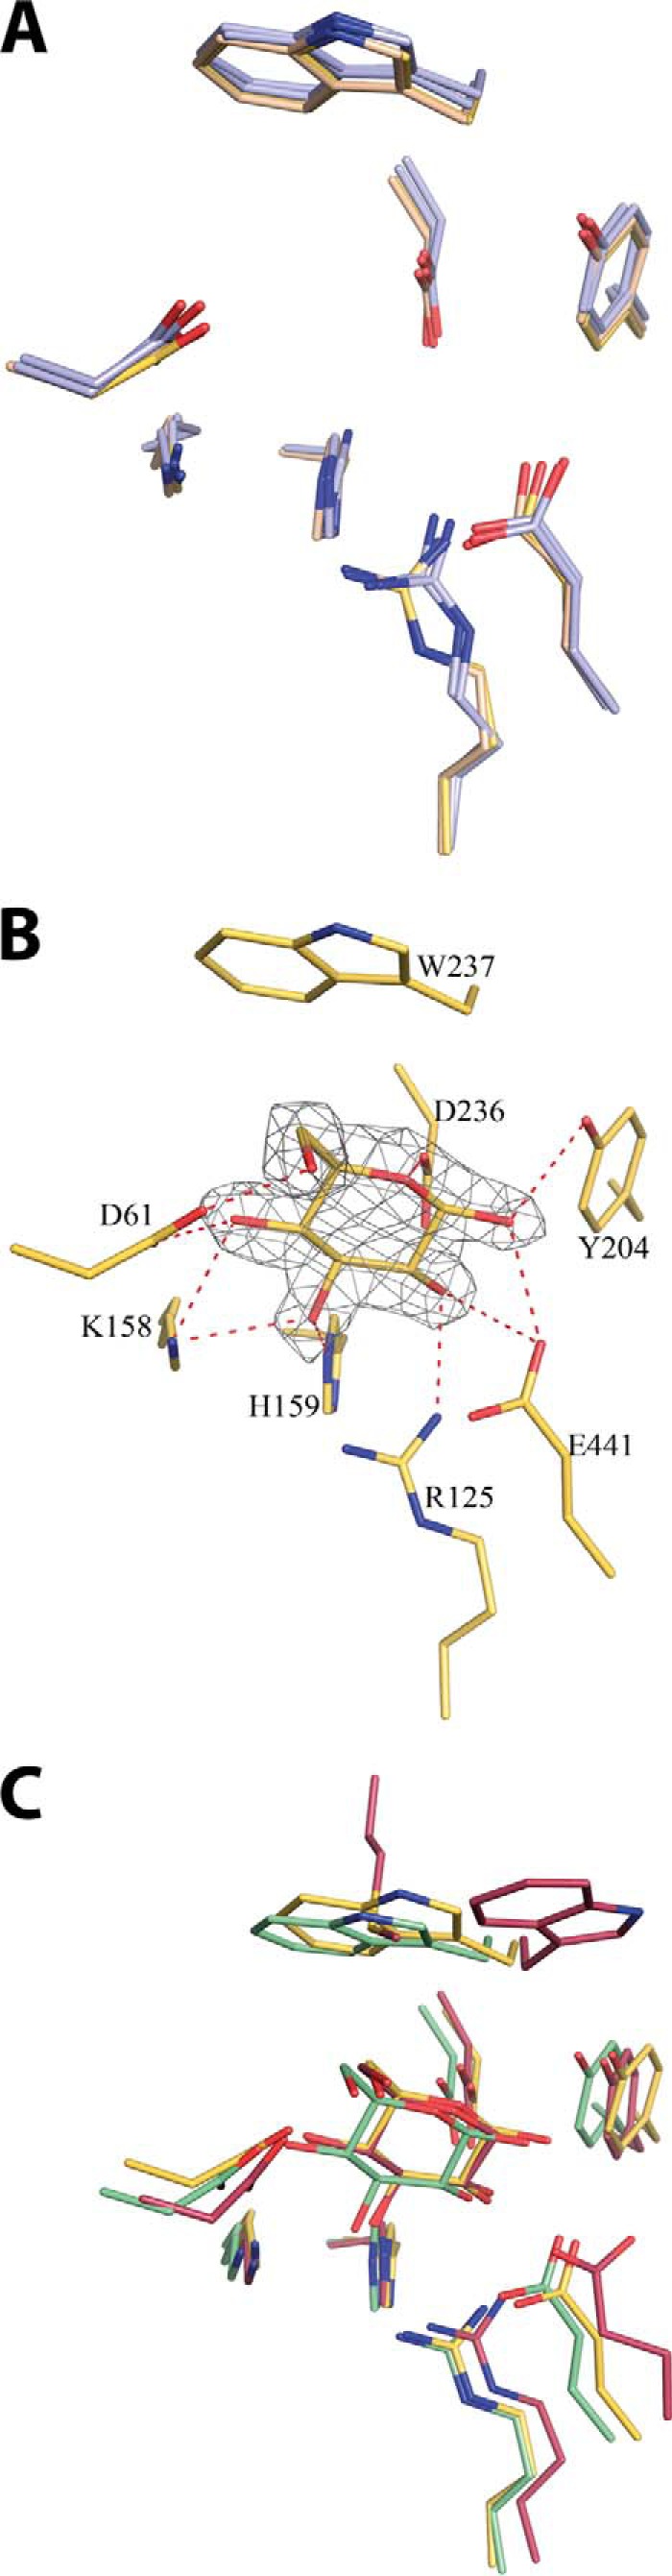
A, overlay of −1 subsite of the four Hj-Cel3A structure models (not showing the glucose): HjCel3A apo (light yellow), HjCel3A + glucose (gold), and both of the Pp-HjCel3A protein molecules of the asymmetric unit (blue). The depicted side chains are the same as in B. B, the −1 subsite of HjCel3A with important residues numbered and depicted using sticks. The bound glucose is shown with electron density contoured at σ level 1. C, a comparison of the −1 subsites of HjCel3A (gold), TnBgl3B (pale green), and HvExo1 (pale red). The HjCel3A −1 subsite is represented by the same residues as shown in B. For TnBgl3B and HvExo1, the corresponding residues are shown.