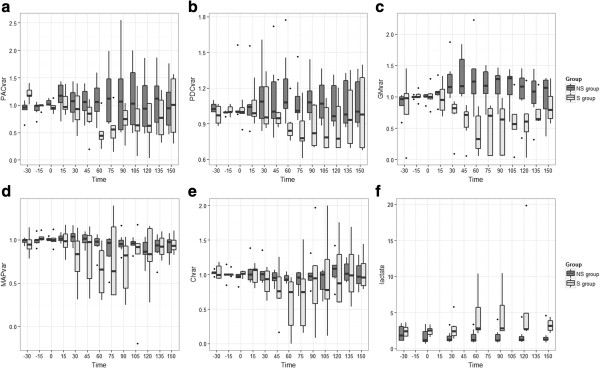
Figure 3.

Evolution of the hemodynamic parameters. (a) PACvar, variation of the component AC of the photoplethysmographic signal, (b) PDCvar, variation of the component DC of the photoplethysmographic signal, (c) GMvar, variation of the laser Doppler signal on the serosa of the duodenum, (d) MAPvar, variation of the mean arterial pressure, (e) CIvar, variation of the cardiac index. T0 is the time of bacterial injection in the septic group (S group) and placebo for the nonseptic group (NS group). T150 is 150 minutes after bacterial injection. ANOVA were performed for each parameter: GM, group effect P <0.001; PAC, group effect P = 0.035; PDC, group effect P <0.001; MAP, group effect P <0.001, time effect P = 0.015; CI, group effect P <0.001; heart rate (HR), group effect P <0.093; lactate group effect P <0.001.
