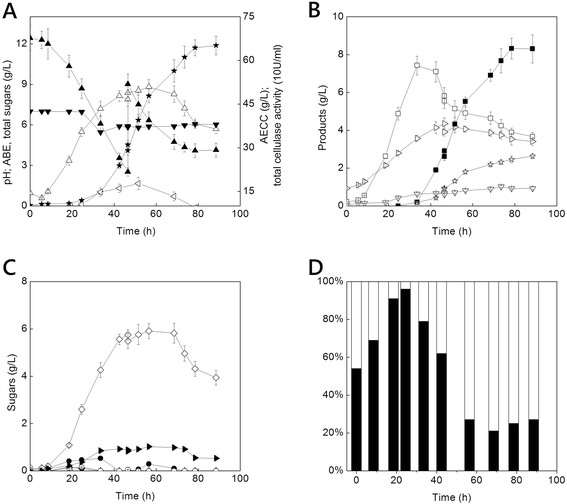
Figure 4.

Time courses of co-culture using optimized strategies. The symbiosis degraded 68.6 g/L AECC and produced 11.8 g/L solvents, which was 108% and 46.5% higher than that obtained under the initial co-culture conditions. Besides, a real-time PCR assay based on the 16S rRNA gene sequence revealed the dynamics of the abundance for each strain. (A) Time courses of pH, solvents production total, cellulase activity, total sugars accumulation and utilization, AECC degradation. (B) Time courses of ABE and organic acids production, (C) Time courses of monosaccharides and dissaccharides accumulation and utilization, (D) Dynamics of relative abundace for C. beijerinckii and C. cellulovorans. ▲AECC, △total sugars, ▼pH, ★ABE, ◁total cellulase activity, ✰acetone, ■butanol, ▽ethanol, ▷acetic acid, □butyric acid, ●cellobiose, ○glucose, ◆xylobiose, ◇xylose, ▶arabinose, White, relative abundance of C. beijerinckii, Black, relative abundance of C. cellulovorans.
