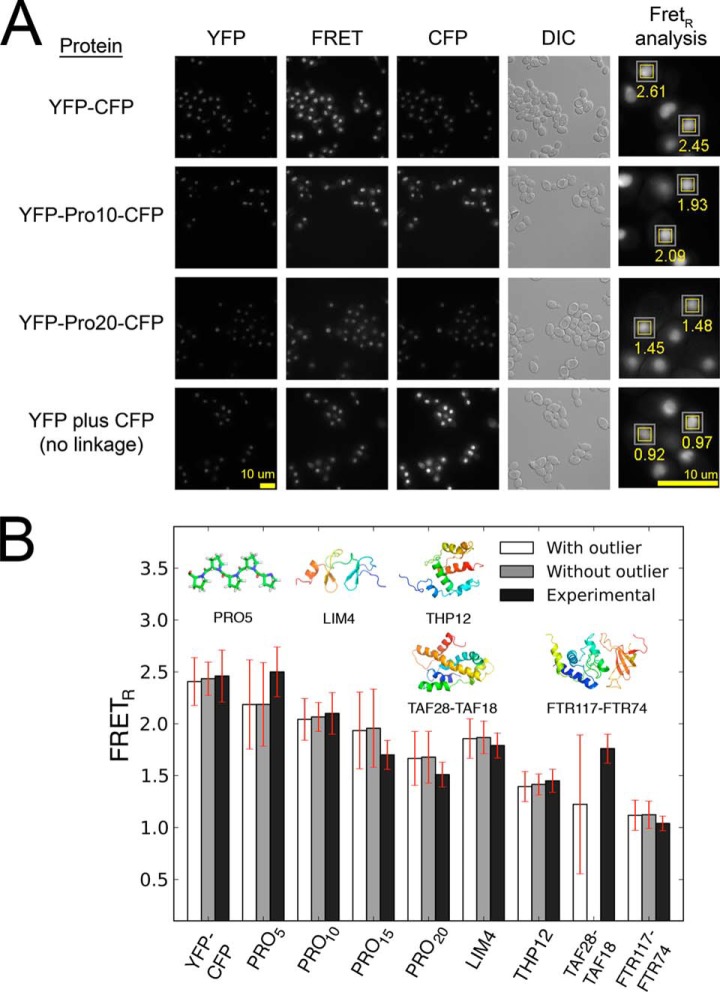
Fig. 3.
Experimental validation of the forward model. FRETR values were determined for nine proteins of known structure. The proteins were stably expressed in S. cerevisiae with nuclear localization signals (see “Computational Methods and Experimental Procedures”). A, a sample of captured images. A 4× enlargement of one region shows the FRETR values determined by FRETSCAL. B, FRETR values measured in vivo on nine proteins of known structure (black bars) compared with the values predicted by the forward model (white bars). The Bayesian parameters were inferred by maximizing the posterior probability on the set of nine measurements. The fit was repeated excluding the outlier data point (TAF28-TAF18) and yielded similar results (gray bars), demonstrating the ability of the Bayesian approach to tolerate outliers. Red error bars indicate experimental standard error and inferred uncertainty.

