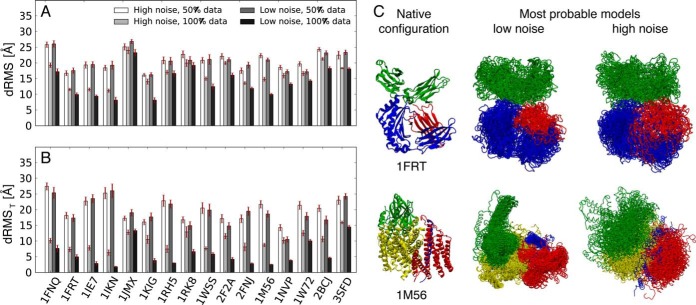
Fig. 4.
Benchmark of a set of complexes modeled using simulated FRETR data. A, B, accuracy of the modeled structures as a function of data sparseness and level of noise. Accuracy was quantified using the average Cα dRMS deviation between the crystallographic structure and the 20 most probable models, each one from an independent run, calculated on the entire complex (A) and on the N- and C-terminal residues (B); red error bars indicate standard error of the mean. C, most probable models of the complex of rat neonatal Fc receptor with Fc (PDB code 1FRT (73)) and of cytochrome c oxidase from Rhodobacter sphaeroides (PDB code 1M56 (27)), with low- and high-noise datasets, and with all pairwise FRETR indices.

