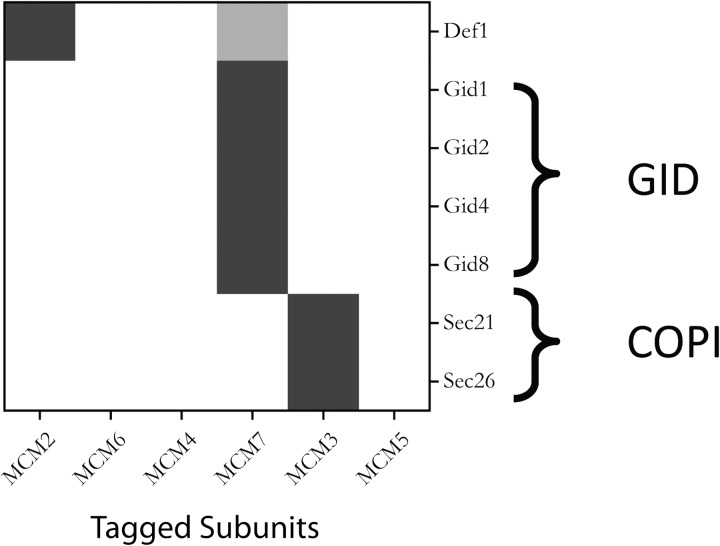
Fig. 5.
Identification of specific interactors for the individual MCM subunits within the non-chromatin bound fraction. The heat map shows the relative increase of the MS signal for proteins with CAI ≤ 0.30 (i.e. with copy numbers ≤ 25,000). The horizontal axis represents protein A-tagged MCM subunits arranged in the order of their connectivity within the MCM complex as determined above. Proteins observed to interact with these MCM subunits are shown on the vertical axis grouped according to the similarity of their binding characteristics with the MCM subunits (see supplementary Methods for details of this hierarchical clustering). Only proteins with an MS/MS count ≥3 and an MS intensity enhancement greater than threefold with glutaraldehyde treatment are shown.

