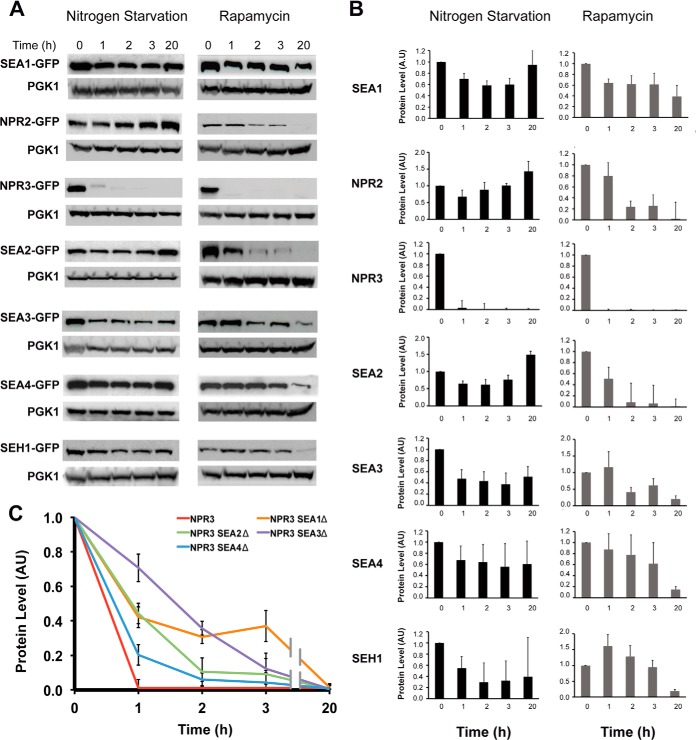
Fig. 6.
Stability of SEA complex components during nitrogen starvation and rapamycin treatment. A, yeast cells carrying a SEA member tagged with GFP were subjected to nitrogen starvation or rapamycin treatment (20 nm final concentration). Samples were collected at indicated time points, and whole cell extracts were prepared and analyzed via Western blotting with anti-GFP or anti-PGK1 antibodies. Error bars represent the standard deviation in three independent experiments. B, the protein level in arbitrary units (AU) was calculated by normalizing the GFP signal to the corresponding PGK1 signal from blots shown in A. The signal at time 0 was set at 1. C, the protein level of Npr3-GFP in indicated deletion strains subjected to rapamycin treatment at different time points was calculated as in B and is represented as a graph. Error bars represent the standard deviation in three independent experiments.

