
Fig. 1.
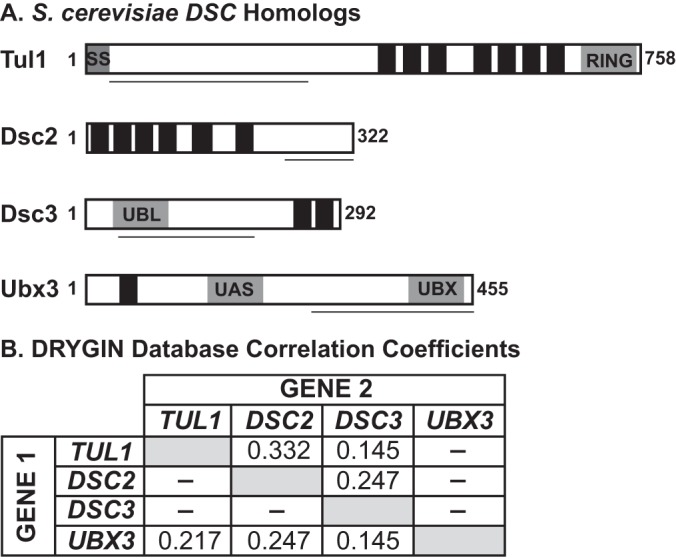
S. cerevisiae Dsc homologs. A, schematics of Dsc homologs in which black boxes represent predicted transmembrane domains. Predicted signal sequence (SS) and conserved domains are indicated. Underlining denotes amino acids used as antigens for antibody production. B, Pearson correlation coefficients between genetic signatures of S. cerevisiae DSC homologs from DRYGIN database (45). Genetic interactions were tested in a pairwise fashion such that each gene yielded two datasets. The database default setting for significance is CC > 0.1, and dashes denote the absence of a correlation coefficient in database.