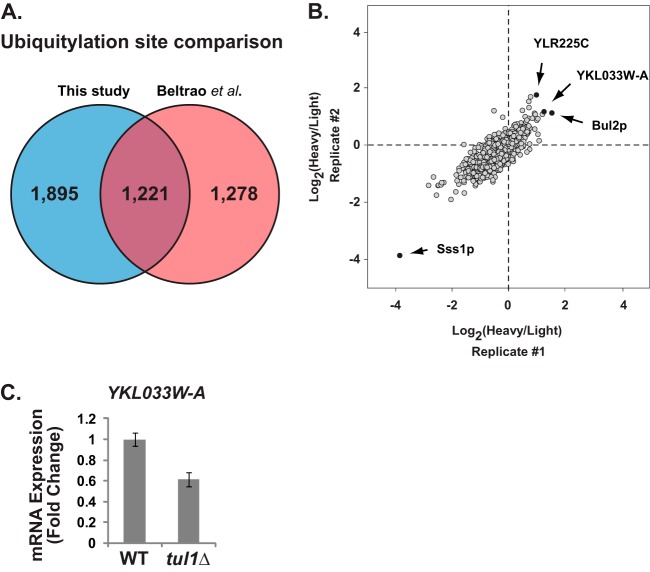
Fig. 6.
Identification of candidate Tul1 substrates using quantitative mass spectrometry. A, Venn diagram comparing ubiquitylation sites found in this study and by Beltrao et al. (22). B, scatter plot of ubiquitylated peptide ratios (wild-type/tul1Δ) from two replicate experiments (n = 2289). C, expression of YKL033W-A mRNA in wild-type and tul1Δ cells. cDNA synthesized from total RNA (1 μg) was quantified via real-time PCR. YKL033W-A mRNA expression was normalized to ACT1 and shown as fold change relative to wild-type cells. Data are the average of three biological replicates, and error bars show standard error among biological replicates.

