
Fig. 6.
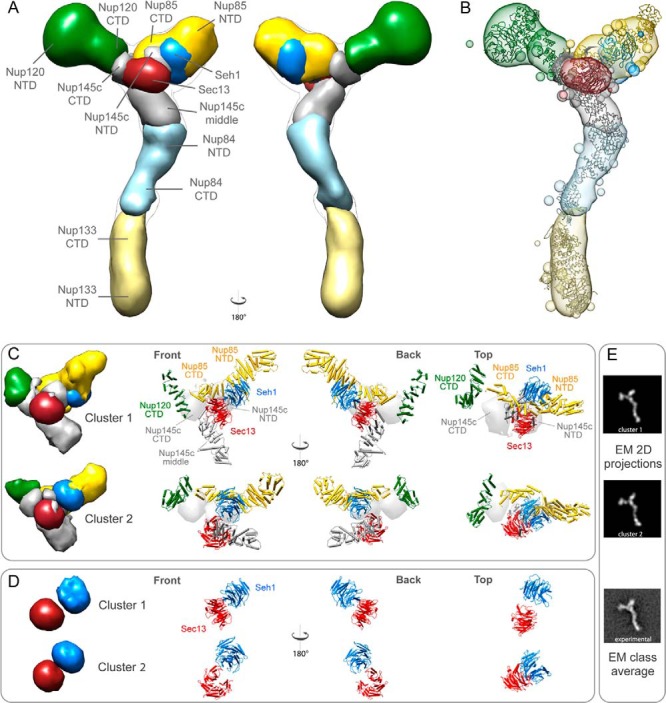
The Nup84 complex molecular architecture revealed by the CX-MS integrative pipeline. The localization density maps of the Nup84 subunits (solid contour surfaces) and the entire complex (transparent surfaces) were computed and contoured at the threshold of 2.5 times their volumes estimated from sequence (supplemental Table S6) (A through C). A, front and back views of the localization density maps of the Nup84 subunits and the entire complex. B, a representative single Nup84 complex structure (colored ribbon) is shown along with the localization density maps of the individual subunits. C, the localization density maps of the two dominant clusters computed on the hub region (Nup120-CTD, Nup85, Nup145c, Sec13, and Seh1) are shown, along with the representative single structures of the hub region for each of the two clusters, from multiple viewing points. D, the positions of Sec13 and Seh1 are presented for each of the two clusters. E, the representative model projections in each of the two clusters are shown, along with the EM class average (14).