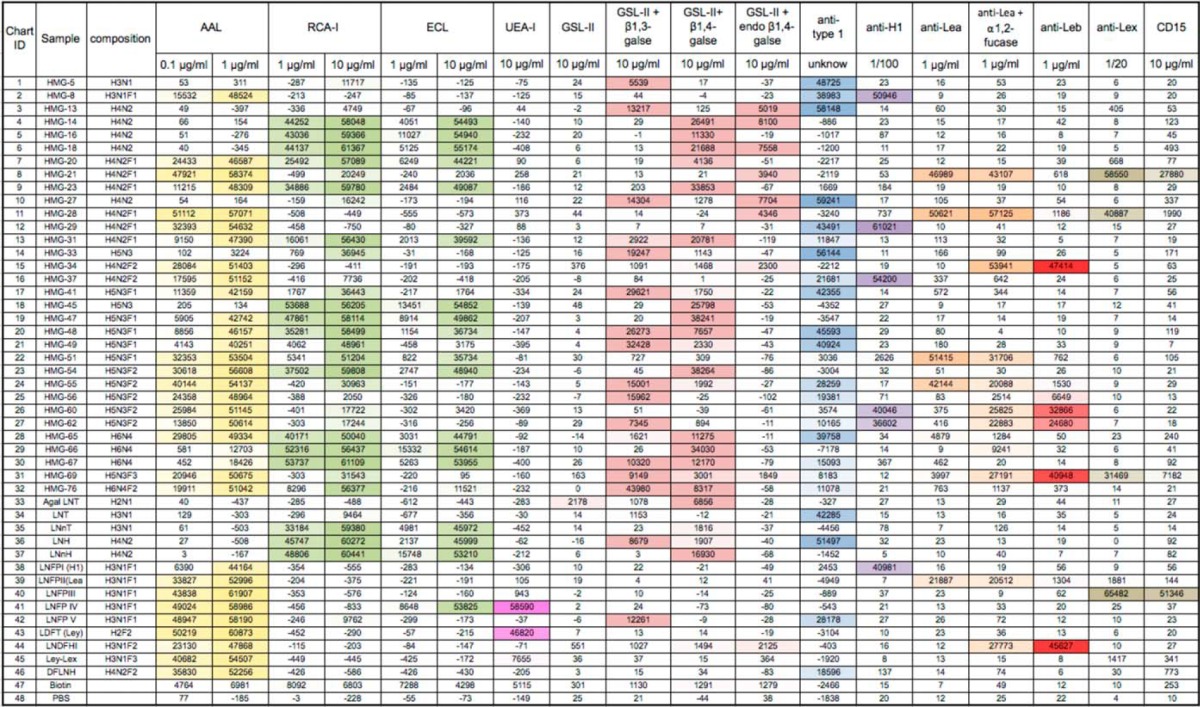
Table I. Heat map of lectin and antibody binding data for structural analysis.
A heatmap summary of the binding data from analyses of the RV-MAGS subarray with different lectins and anti-carbohydrate antibodies at indicated concentration. A total of 46 glycans were printed on this array, including 14 control glycans and 32 selected RV VP8* binders. The color-coded numbers highlight the binding intensity (the darker the color, the higher the binding intensity). The untreated RV-MAGS slides were tested with 5 lectins and 6 antibodies. The slides treated with β1–3 galactosidase (β1–3 galse) and β1–4 galactosidase (β1–4 galse) were tested with GSL-II. The slide treated with α1–2-fucosidase (α1,2-fucase) was assayed with anti-Lea antibody.