
Fig. 5.
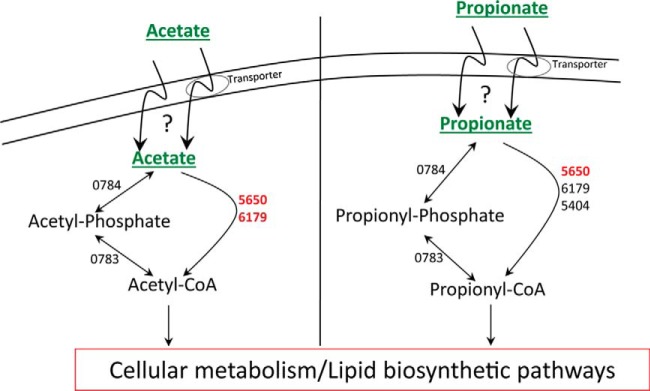
Acetate and propionate activation pathways. Proteins showing higher abundance in either acetate or propionate compared with glucose are indicated in red type; proteins that are present at similar levels in all three carbon substrates (glucose, acetate, and propionate) are indicated in black type.