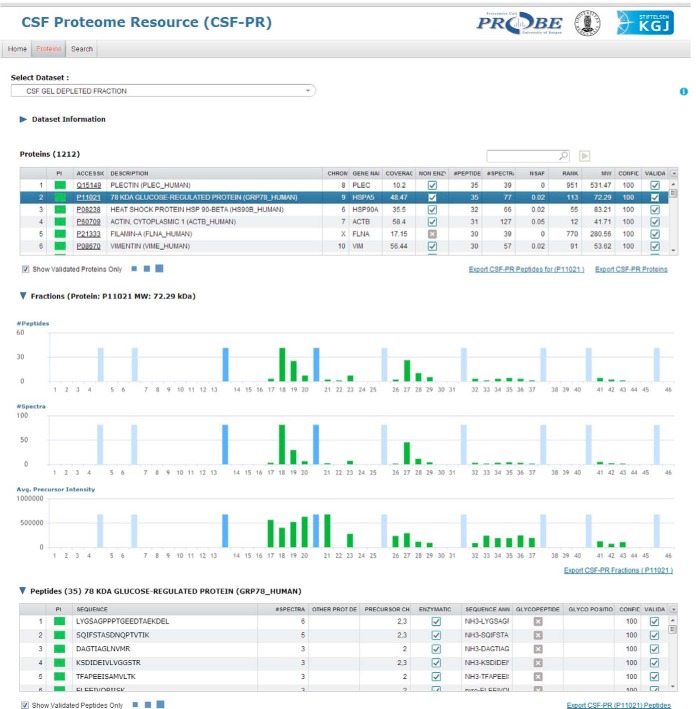
Fig. 4.
Overview of the CSF Proteome Resource (CSF-PR), showing a selected experiment and the proteins identified in this experiment, and the distribution of the selected protein across the gel fractions is shown in green bars at the bottom, with gel standards marked by light blue bars. The slightly darker blue bars represent the range where the protein's theoretical molecular mass would suggest that the protein should occur.

