
Figure 11.
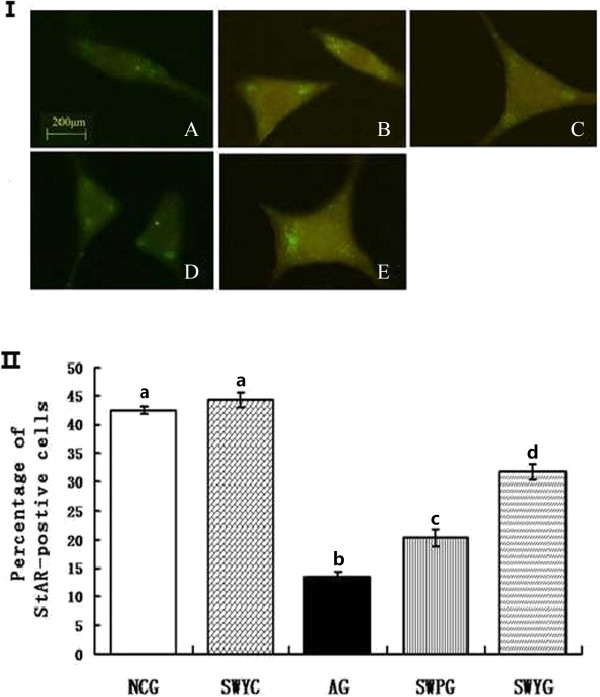
Fluorescence immunocytochemistry for observation of StAR expression (I) and StAR-positive cells (II) in Leydig cells. A: aging group; B: normal control group; C: Heshouwuyin control group; D: Shouwu pill group; E: Heshouwuyin group. Scale bar, 200 μm. NCG: normal control group; SWYC: Heshouwuyin control group; AG: aging group; SWPG: Shouwu pill group; SWYG: Heshouwuyin group. Each histogram represents the mean ± SD of the values for 5 rats. Columns with different letters represent statistically different values, while same letters indicates no significant difference.