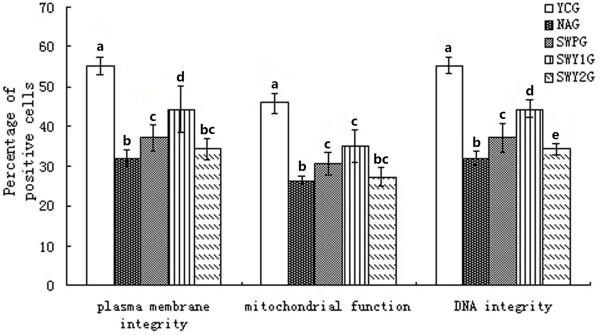
Figure 4.

Plasma membrane integrity, mitochondrial function and DNA integrity of sperm in different groups. YCG: young control group; NAG: natural aging group; SWPG: Shouwu pill group; SWY1G: Heshouwuyin group 1; and SWY2G: Heshouwuyin group 2. Each histogram represents the mean ± SD of the values for 10 rats. Columns with different letters represent statistically different values, while same letters indicates no significant difference.
