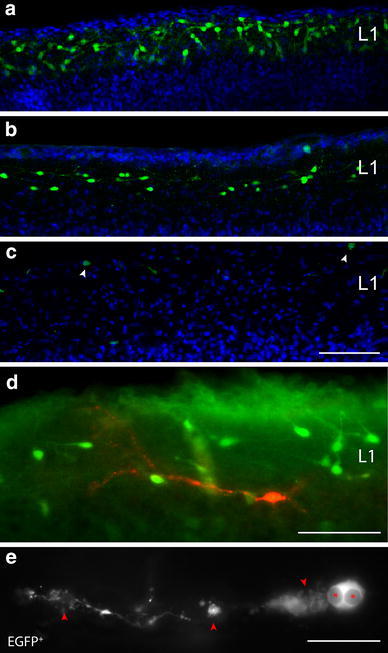
Fig. 1.

Confocal images showing the differential expression of CXCR4-EGFP in CR cells during early postnatal development and CR cells undergoing cell death. a CR cells in the neocortex reached their highest density and peak of expression around P4 thereby forming a dense network of neurons exclusively confined to layer 1. Note that CR cells were still present at relatively high numbers between P7 and P11 (b), but nearly completely disappeared at P14, with only a few scattered neurons (arrowheads in c). Scale bar in a–c is 100 μm. d Fluorescent image of a CXCR4-labeled CR cell undergoing selective cell death as revealed by Caspase-3 immunoreactivity (red) at the onset of apoptosis at P8. Note the numerous non-Caspase-3 positive CR cells in the surrounding neuropil in layer 1. Scale bar in d is 50 μm. e High power fluorescent images of a degenerating CXCR4-EGFP-labeled CR cell showing the characteristic dendritic swellings (arrowheads) and the pyknotic nucleus in the cell body (asterisks). Scale bar in e is 20 μm
