Fig. 12.

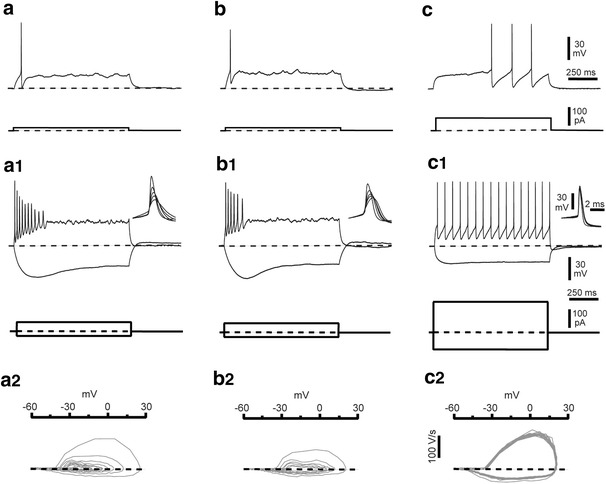
Firing patterns of CR cells compared to those of GABAergic interneurons in layer 1. a–a2, b–b2 Voltage responses of typical (left panels) and ‘atypical’ (middle panels) CR cells to depolarizing and hyperpolarizing current pulses of 1 s duration; the membrane potential of both cells was held close to −60 mV. Panels a and b show the response to low amplitude positive current pulses, whereas panels a1 and b1 show firing patterns in response to stronger depolarizing and hyperpolarizing current pulses. a2, b2 Phase plots of the trains of action potentials are displayed in the middle insets. Notice the typical progressive change of the action potentials. This is also shown in the insets where the first five action potentials have been adjusted so that the action potential thresholds coincide and superimposed. Trains of action potentials in CR cells were characterized by spike broadening and eventual depolarization block. Both CR cells show a typical ‘sag’ in the hyperpolarizing response, indicative of the presence of Ih. c–c2 Analogous to a–a2 and b–b2 but the recording was performed in a L1 GABAergic interneuron. Note the different size of the current steps used and the different shape of the action potentials and firing pattern and the marked difference in the phase plot of the trains of action potentials
