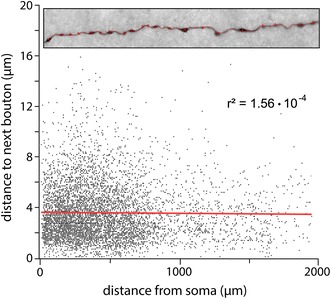
Fig. 6.

Quantitative analysis of the axonal bouton density and distribution. Dot plot showing the density, distribution and distance of synaptic boutons along the reconstructed axons of CR cells. Inset axonal collateral of a CR cell showing the method of analysis. First, a line was drawn along the axon; then a marker was placed at the center of each synaptic bouton which allows the interpolation of the distance between two adjacent boutons. Note that the ‘distance to next bouton’ seems to be independent from the distance to the soma as shown by the red fitting line and the r² value
