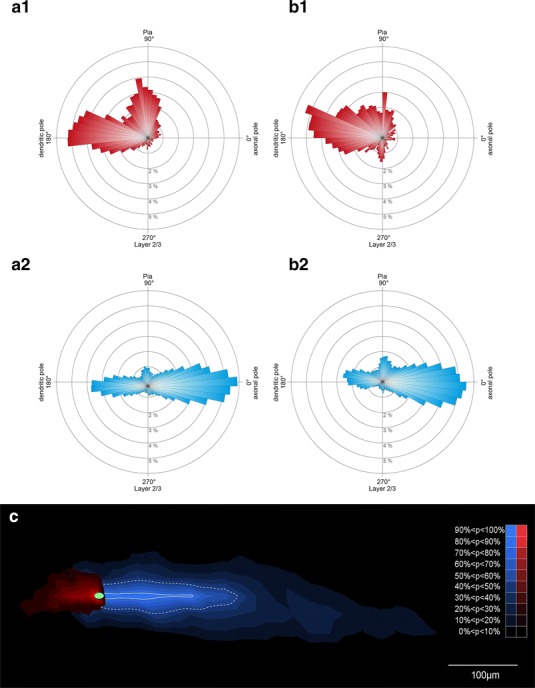
Fig. 7.

Quantitative analysis of the dendritic tree and axon of CR cells. Averaged and normalized polar plots showing the distribution pattern of the dendritic and axonal domains of typical (a1, a2) and ‘atypical’ (b1, b2) neocortical CR cells. The dendritic domain is given in red, the axonal domain in blue. b1–b2 Note the high degree of polarity of both dendrites and axons but the slight difference in the orientation and distribution of dendrites and axons between typical and ‘atypical’ CR cells. c Averaged and normalized density plot showing the extension of the axonal domain (blue) and the dendritic arborization (red) of all neocortical CR cells investigated. The solid white line represents 50 % and the dashed line 80 % probability of appearance in the distribution of the axon
