Figure 6.

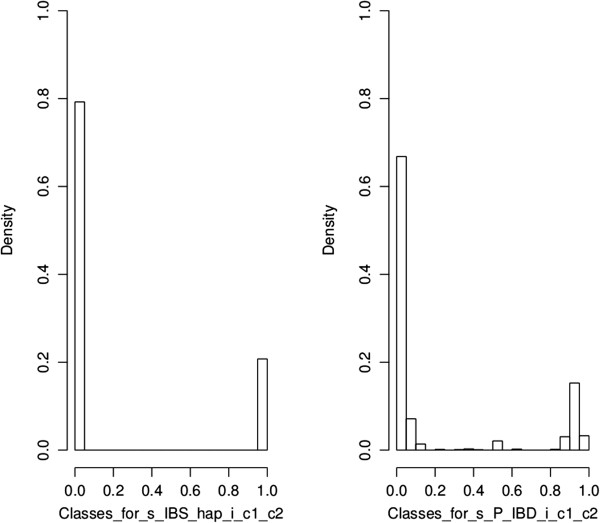
Distribution of values for IBShap and P(IBD) between chromosome segments around the simulated QTL for the moderate LD situation (), example for one simulation. The class width for the IBD probabilities is equal to 0.05.

Distribution of values for IBShap and P(IBD) between chromosome segments around the simulated QTL for the moderate LD situation (), example for one simulation. The class width for the IBD probabilities is equal to 0.05.