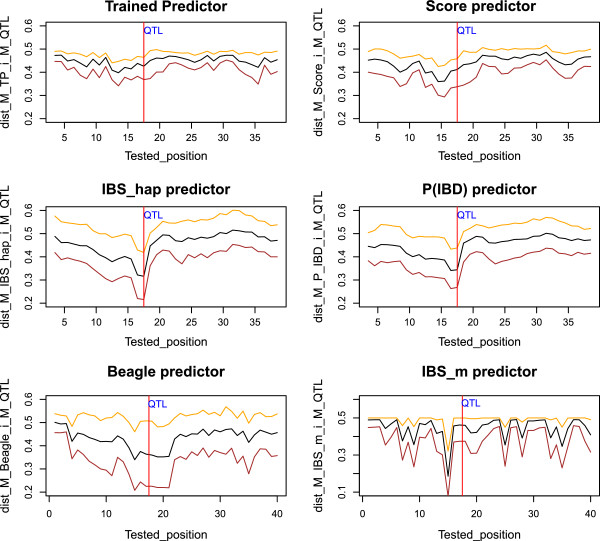
Figure 7.

The mean and sample quantiles at 2.5% and 97.5% of (black, brown and orange respectively) for TP, Score, IBS hap , P(IBD), Beagle and IBS m , with respect to the tested position and the simulated QTL position (red line) for the moderate LD situation ().
