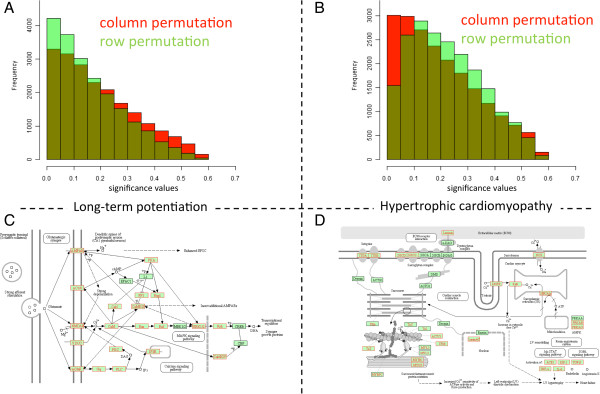
Figure 4.

Difference between row- and column permutations. The histograms in panel A and B show for two pathways the significance values as calculated for row and column permutations, respectively. Panels C and D present the respective pathways as provided by KEGG. Here, red marked genes correspond to significant genes in our GWAS.
