
Figure 5.
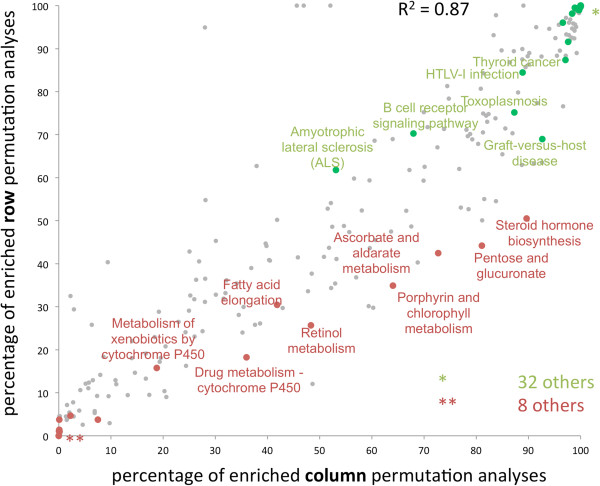
Comparison between enriched and depleted pathways. Each dot corresponds to one pathway. Red dots correspond to depleted and green dots to enriched pathways.
Official websites use .gov
A
.gov website belongs to an official
government organization in the United States.
Secure .gov websites use HTTPS
A lock (
) or https:// means you've safely
connected to the .gov website. Share sensitive
information only on official, secure websites.
Comparison between enriched and depleted pathways. Each dot corresponds to one pathway. Red dots correspond to depleted and green dots to enriched pathways.