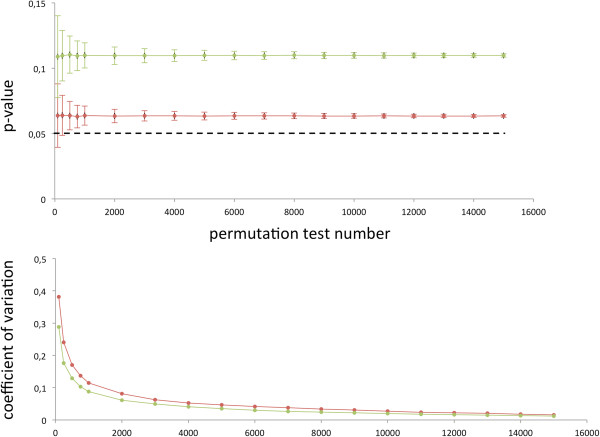
Figure 6.

Influence of the number of permutations. The upper panel of the figure shows for column (red) and row (green) permutation tests the average significance value and the standard deviation for “Pathways in cancer”. The lower panel shows the coefficient of variation (CV) for both approaches.
