Figure 3.

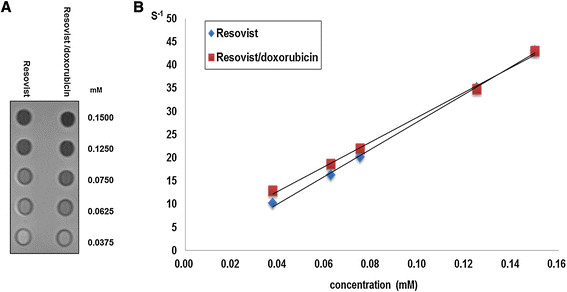
Measurement of MR relaxivities. A) T2-weighted MR image of the phantom for relaxivity measurement. B) Plot of the inverse transverse relaxation times (1/T2) vs. Fe concentration. The slopes indicate the specific relaxivity value (r2).

Measurement of MR relaxivities. A) T2-weighted MR image of the phantom for relaxivity measurement. B) Plot of the inverse transverse relaxation times (1/T2) vs. Fe concentration. The slopes indicate the specific relaxivity value (r2).