
Figure 1.
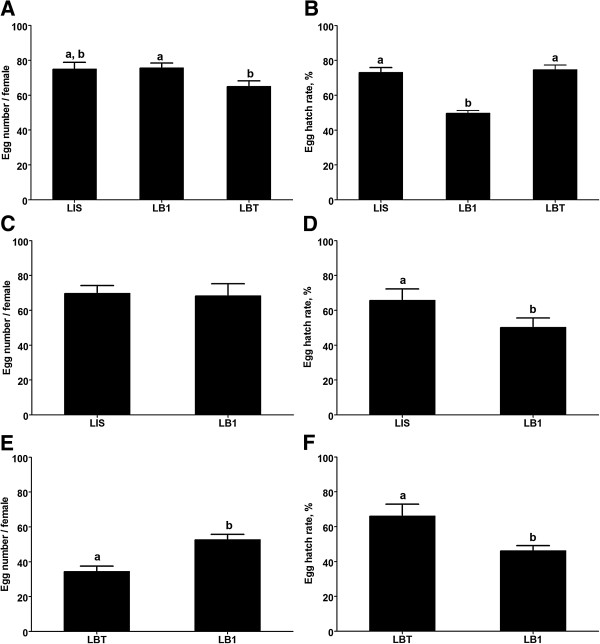
Impact of wAlbB on An. stephensi fecundity. The number of eggs laid by each individual female and the hatch rate after feeding on mouse (A, B), sheep (C, D) or human (E, F) blood. For all figures, error bars represent standard error; statistical significance is represented by letters above each column, with different letters signifying distinct statistical groups [P < 0.05; Student’s t-test for (A and E); P < 0.0001; chi-squared test for (B, D and F)].