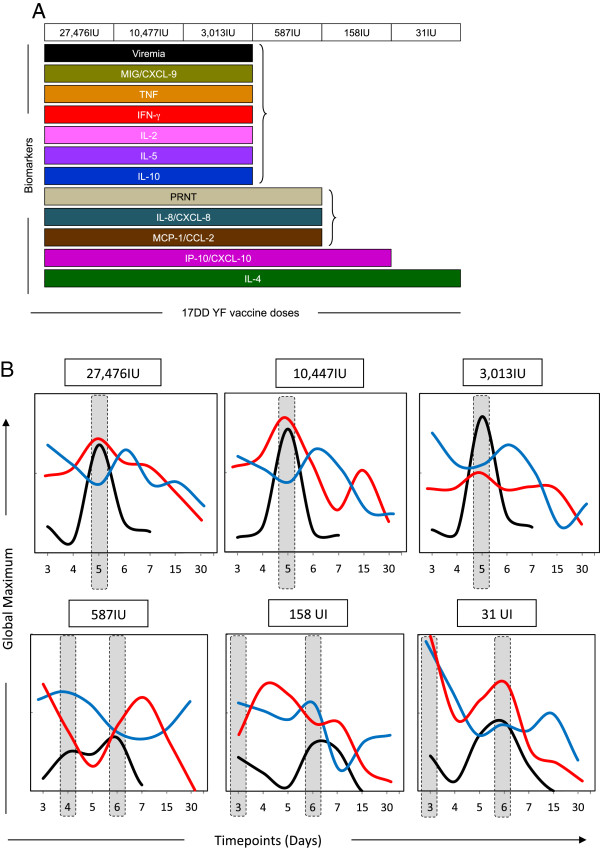
Figure 6.

Snapshot of immunological and virological biomarkers following 17DD-YF primary vaccination with different doses (27,476 IU-current; 10,447 IU; 3,013 IU; 587 IU; 158 IU and 31 IU). (A) Selection of biomarkers with equivalent kinetics timeline with viremia and PRNT [Viremia ( ); PRNT (
 ); IL-8/CXCL-8 (
 ); MCP-1/CCL-2 (
 ); MIG/CXCL-9 (
 ); IP-10/CXCL-10 (
 ); TNF (
 ), IFN-γ (
 ) and IL-2 (
 );IL-4 (
 ), IL-5 (
 ) and IL-10 (
 )]. (B) Overlay graphs highlighting that IFN-γ and IL-10 are relevant complementary biomarkers associated with the viremia kinetics. Results are expressed as the global maximum values of each timepoint to baseline (viremia,
  , range 0 to 1.6E + 04 copies/mL; INF-γ,
  , range 0 to 4 baseline fold; IL-10,
  , range 0 to 2 baseline fold).
