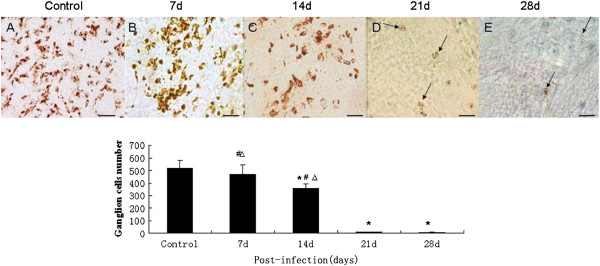
Figure 3.

Number of surviving retinal ganglion cells of the mice infected by A. cantonensis at various times. (A-E) Surviving ganglion cells after infection with A. cantonensis for 0 d, 7 d, 14 d, 21 d, and 28 d, respectively. Number of surviving ganglion cells decreased as the length of infection time increased. On days 21 and 28, fewer ganglion cells can be seen (black arrows in D and E). Scale bar = 40 mm. (E) Data are mean ± SEM of retrograde labelled RGCs/mm2 in control, 7 d, 14 d, 21 d, and 28 d, respectively after infection with A. cantonensis. *Statistically significant when compared with control (0 d infection) (P < 0.05); # Statistically significant when compared with infection for 21 d (P < 0.05); △Statistically significant when compared with infection for 28 d (P < 0.05).
