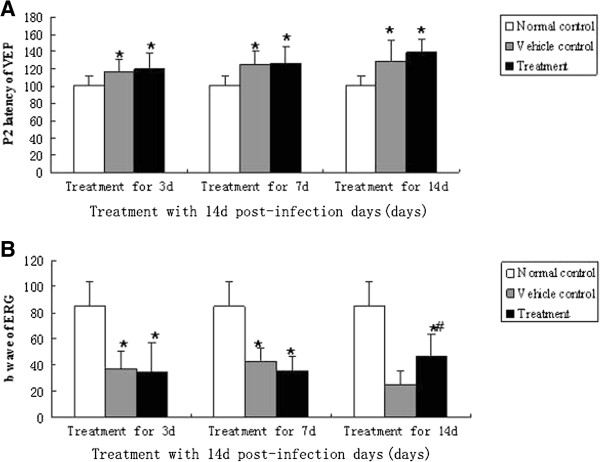
Figure 9.

VEP and ERG alterations of mice infected with A. cantonensis. (A) Data are mean ± SEM for P2 latency alterations of VEP in normal, vehicle control and treated mice at 3 d, 7 d and 14 d after infection. There was no difference in infected, treated and the infected, untreated groups at various times. However, in the infected, treated and infected, untreated groups, there are obvious differences compared to normal controls. (B) Data are mean ± SEM for b wave amplitude of ERG in normal, vehicle control and treated mice at 3 d, 7 d and 14 d. after 3 and 7 d of treatment, there was no difference between treated-groups and untreated-groups. Both treated group and untreated-group had an obvious decrease in b wave amplitude compared to normal controls. After 14 d of treatment, amplitude of the b wave in the treated group had increased compared to the untreated group, though b wave amplitude still not recovered to a normal level in the treated group. *Statistically significant when compared with normal control (P < 0.05); #Statistically significant when compared with groups without treatment (P < 0.05).
