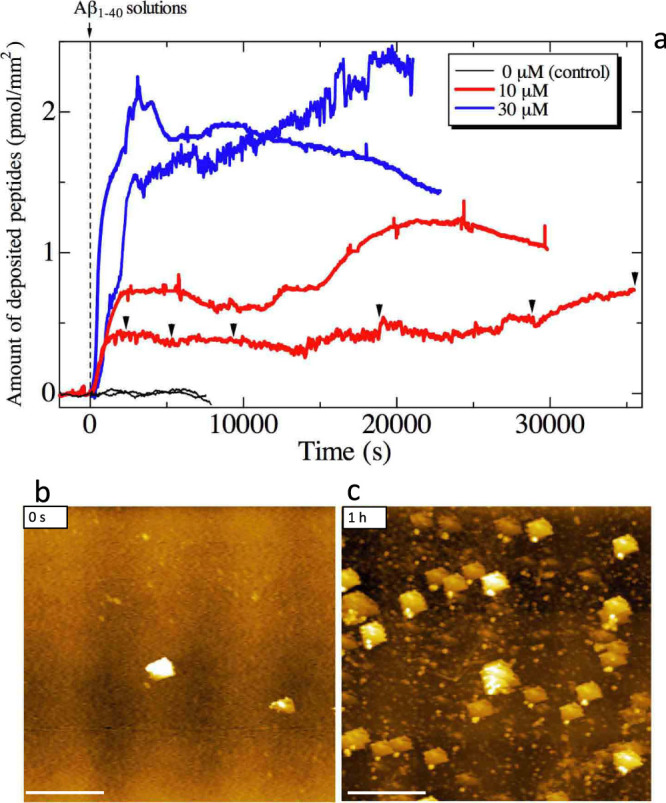
Figure 1. Monitoring deposition reactions.

(a)The resonance frequency (~58 MHz) of the quartz resonator was monitored during the deposition reaction of Aβ1–40 peptides, which yielded the amount of accumulated peptides on the surface. The peptides quickly accumulate on the surface-immobilized Aβ1–42 seeds just after the reaction. Two independent measurements are shown for each peptide concentration. Brack inverted triangles indicate the time at which the TIRFM images are shown in Fig. 2a–2g. (b)An AFM image on the quartz surface before the deposition reaction, and (c) that after 1 h for a 10-μM-Aβ1–40 solution-flow measurement. The scale bars indicate 2 μm.
