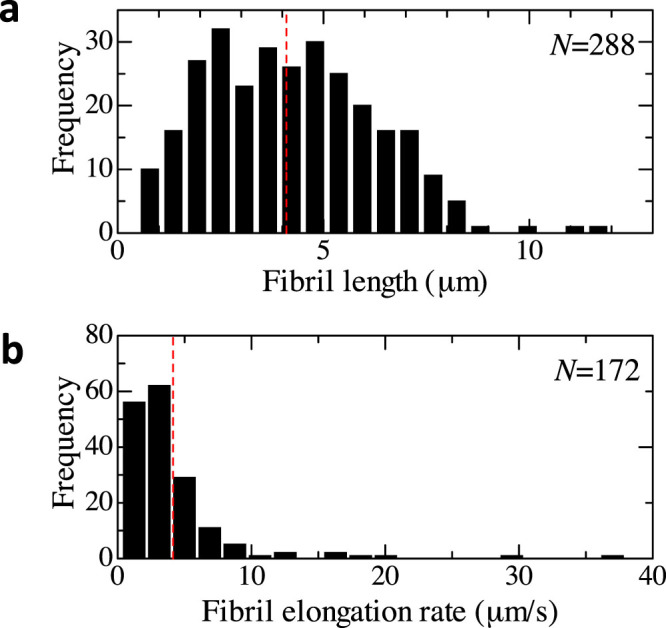
Figure 4. Histograms for fibril length and growth rate.

(a) and (b) show histograms of fibril length and fibril elongation rate in the solution-flow measurement (10 μM Aβ1–40), respectively. The fibril length was measured by the segmented-line mode of the image J. The growth rate was evaluated for fibrils, which originated from and reached nuclei, by dividing the fibril length by the time needed to reach the other nucleus.
