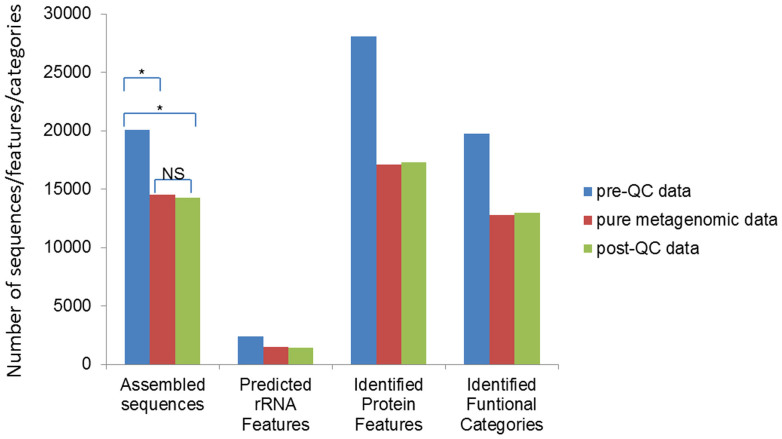
Figure 8. Comparison of downstream analysis statistics of Dataset D before and after QC process by QC-Chain.
The sequences were assemble by IDBA_UD and annotated by MG-RAST. Simulated Dataset D (refer to Table S4 in supporting information File S1) was used as the testing data. *: significantly different (t-test p-value < 0.05); NS: not significantly different (t-test p-value > 0.05).

