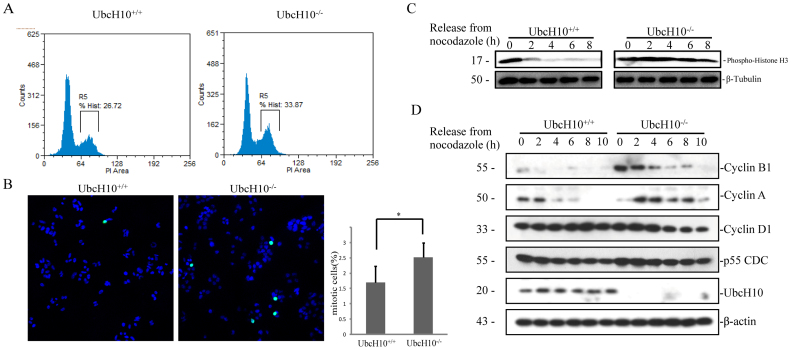
Figure 4. The cell cycle distribution is altered in UbcH10-deficient cells.
(A) The proportion of cells in each phase of the cell cycle was analyzed using flow cytometry in UbcH10-deficient cells. The DNA contents of the treated cells were detected using flow cytometry. The number of cells in each phase of the cell cycle was counted and plotted via R5. (B) The cells in G2/M phase were stained via immunofluorescence of Histone H3.1 (phospho Ser10). The blue and green dots represent DAPI and phosphor-H3.1 positive cells, respectively. (mean ± S.E.; *P< 0.05) (C) Histone H3.1 (phospho Ser10) level change after nocodazole blocking. (D) Protein expression levels of cyclins in the indicated cell lines. The cells were synchronized with thymidine and nocodazole, and collected at the indicated times after release from nocodazole treatment. The cell lysates were analyzed via immunoblotting using the indicated antibodies. β-Tubulin and β-actin were used as loading control.

